Book a Visit
Telephone:
023 8089 2341
adminoffice@cadland.hants.sch.uk
Home
About Us
Our Values
STAR Learners
Who’s who?
Vacancies
Contact
Visit Our School
Information
Inclusion & Safeguarding
SEND
Pupil Premium
Sport Premium
DfE Performance Tables
Admissions
Attendance
Policies & Other Documents
Governors
Governor Details
Governor Attendance 2025/26
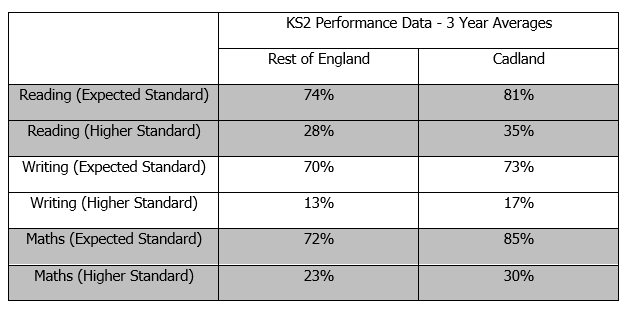
Key Stage 2 Results
Ofsted
Parents
Remote Learning Offer
Core Curriculum
Foundation Curriculum
Term Dates
Uniform
Parent View
Online Payments
Online Safety
School Meals
Travelling to School
Wraparound Care
British Values
Calendar
Parent Support
Hamshire Family Information & Support Service
SEND in Hampshire
Support Strategies for Neurodiversity
Other support for parents, carers and families
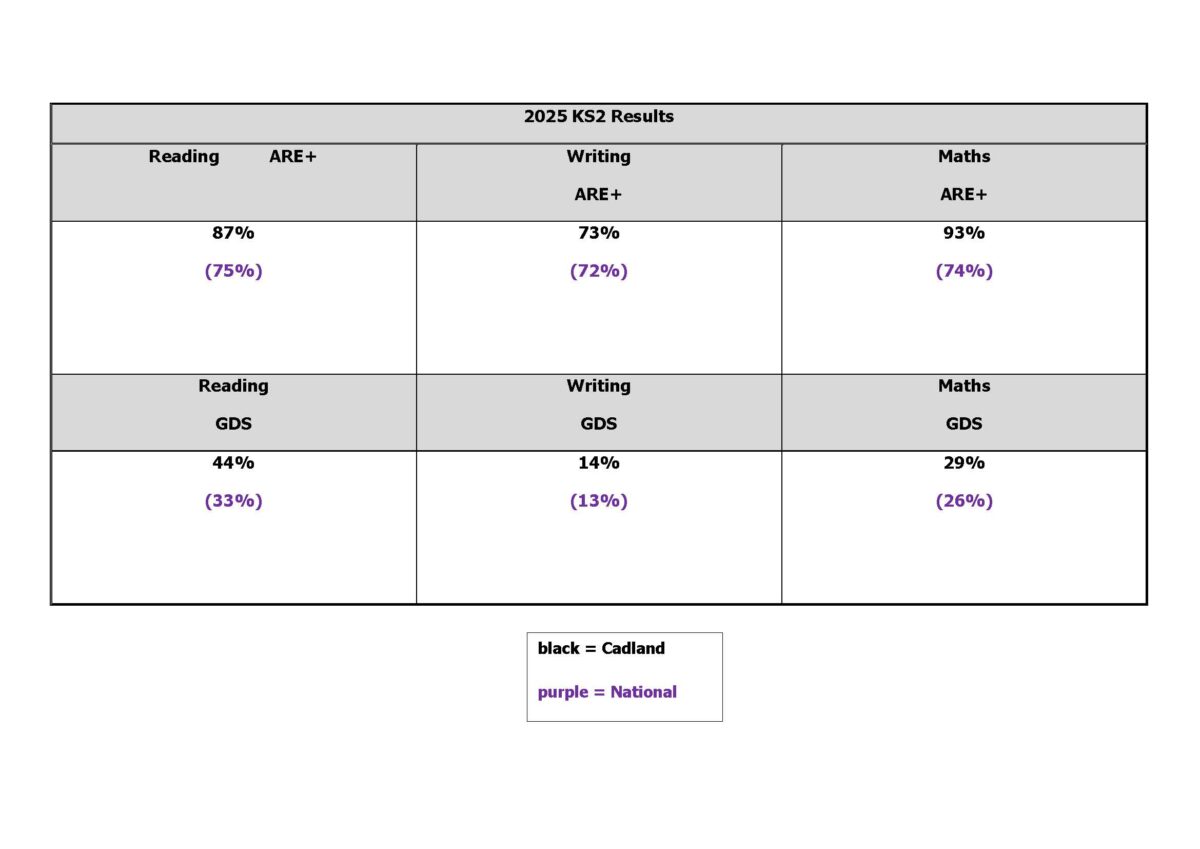
Key Stage 2 Results
Key Stage 2 Results 2025